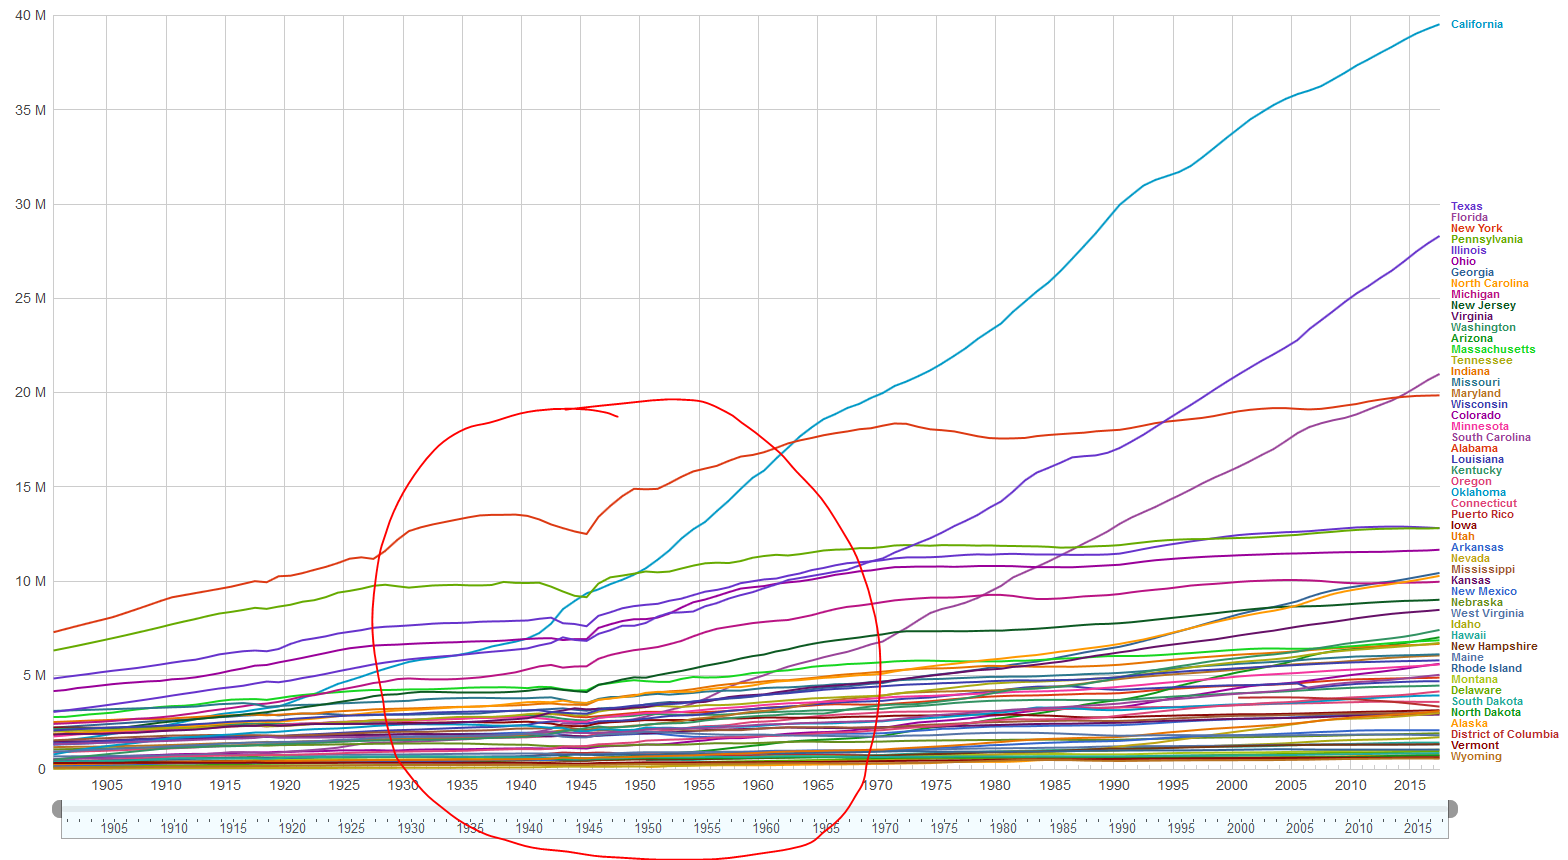
During the war the reason for the internal civilian migration was jobs fueled by war production. After the war people left the north east for the sunbelt, for jobs and with the increased use of air-conditioning the sun-belt became a much more attractive / comfortable option.
WW2 Years
17 Million new good paying civilian jobs were created across the country in war production facilities. That went along with but does not include the 12 millions workers who left the economy to serve in the US Armed forces during WWII. 21% of civilians during the war years moved counties as Workers flocked to new opportunities. That was twice the civilian movement before the war.
Joseph Stalin during a dinner at the Tehran Conference, 1943
Without American production the Allies could never have won the war.
This diagram shows during the war, more people leaving Northeastern region of US than any other region, per the question. With the West receiving the most new people while losing the fewest to other regions.
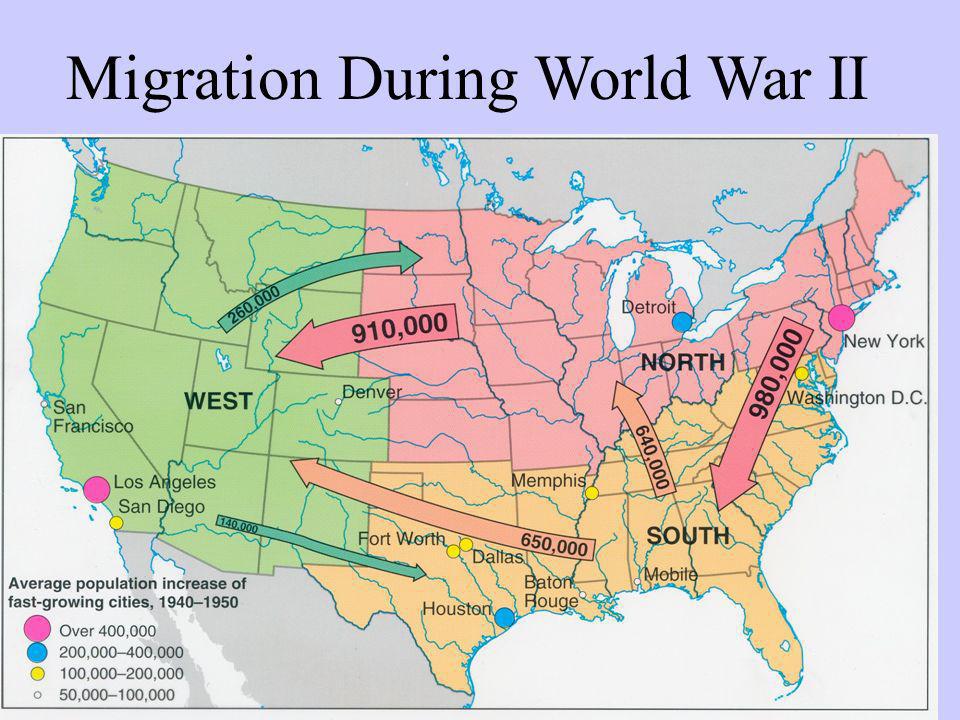
Demographic Changes:
- War Industries sucked people into boomtowns
- Los Angeles
- Detroit
- Seattle
- Baton Rouge
- California’s Population grew by two million
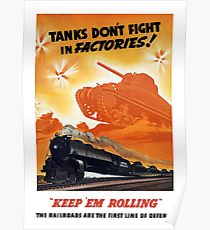
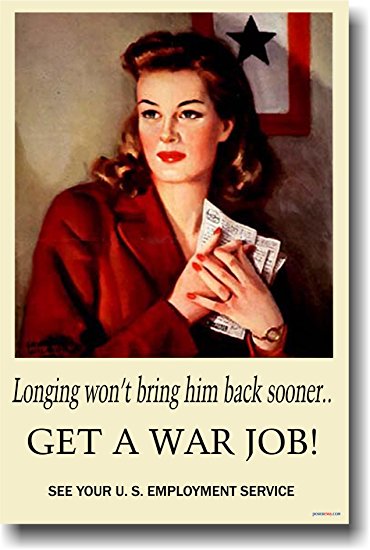
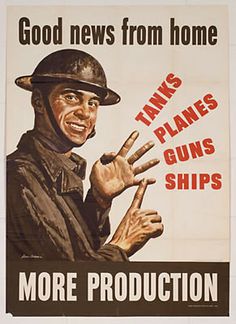
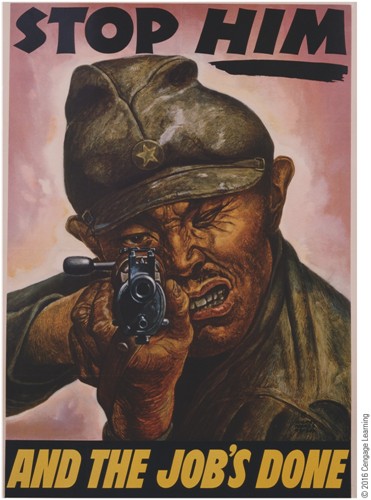
Where I grew up there were still several large housing sub divisions built originally to house all the new workers who swarmed into the area to fill out new labor needs for WWII.
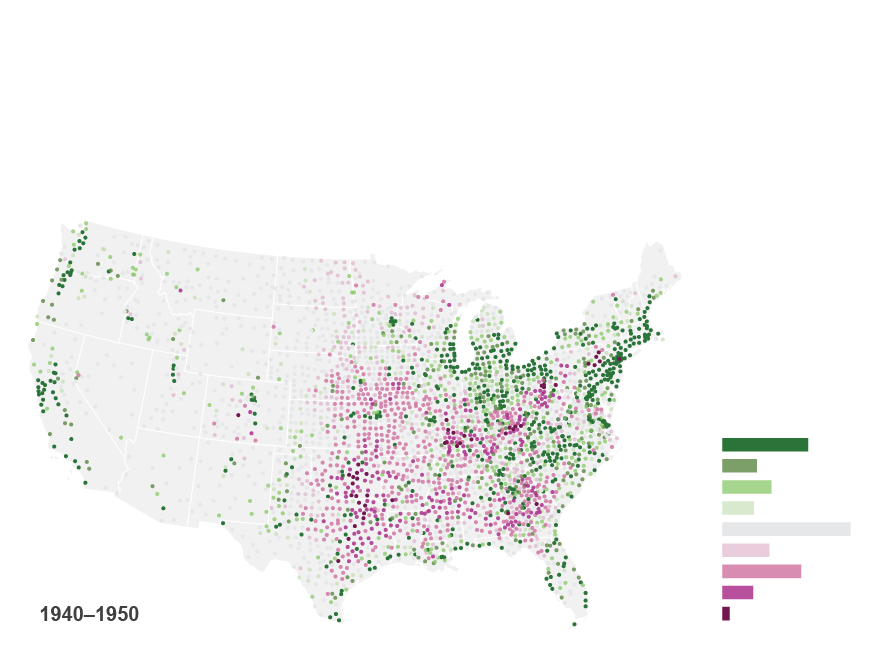
You can see the noticeable shift as people moved into areas like Detroit and West Coast to build planes and tanks in this census demographic map which shows shift from 1940-1950.
** US Census Change in Population Density by Counties
Pink / Red is indication of loss of people per square mile.
Green / Dark Green is gain of people per square mile.
Between 1935 and 1940, 12 percent of the population moved to another county or state. This represented a lull in population movement that changed during and after WWII as geographic mobility increased in the U.S. For instance, between 1940 and 1947, 21.5 percent of civilians moved to different counties or states.
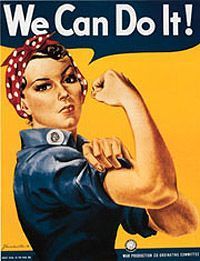
We all know about Rosie the Riveter as an example of women taking up the call for labor and building tanks, planes, and ships for the war effort. That was only part of the story. The demand for labor meant new opportunities not just for women but for minorities and anybody willing to work. New communities and new production centers. The US unemployment rate was still hovering around 24% in 1938 when the War started. The war effort transformed the economy not only into full employment but pulled non traditional workers in too.
The Way We Won: America's Economic Breakthrough During World War II.
America's response to World War II was the most extraordinary mobilization of an idle economy in the history of the world. During the war 17 million new civilian jobs were created, industrial productivity increased by 96 percent, and corporate profits after taxes doubled. The government expenditures helped bring about the business recovery that had eluded the New Deal. War needs directly consumed over one-third of the output of industry, but the expanded productivity ensured a remarkable supply of consumer goods to the people as well. America was the only that saw an expansion of consumer goods despite wartime rationing. By 1944, as a result of wage increases and overtime pay, real weekly wages before taxes in manufacturing were 50 percent higher than in 1939. The war also created entire new technologies, industries, and associated human skills.
The war brought full employment and a fairer distribution of income. Blacks and women entered the workforce for the first time. Wages increased; so did savings.
California
California and the Second World War
While Californians were learning to live with war fears their aircraft and shipbuilding industries exploded with defense work. Unemployment virtually disappeared and every one was called upon to do their share for the war effort. California's huge oil and mineral resources were cranked up to full production, new industries of all kinds sprang up, train loads of people flocked to California looking for work, and her southern border was opened to Mexican workers. During the war California would receive 11.9% of all U.S. Government war contracts and her plants and workers would produce 17% of all war supplies made in the U.S. Military bases were built by the dozen, sometimes in little towns that people in the big cities didn't even know existed. California's deserts became bombing ranges, her harbors became naval bases, her airports became air bases and infantry and tanks rumbled across her farm lands, orchards and deserts. During the course of the war California would acquire more military installations, by far, than any other state.
During the long war years California's big cities became mega-cities and the automobile became the main means of transportation. Already, California lead the nation in the number of cars; one for every 2.3 persons in the state. The Los Angeles area, already large and growing rapidly before the war, experienced the greatest growth of any metropolitan area in the country. By the end of the war the Los Angeles metropolitan area stretched 80 miles solid from the San Fernando Valley to San Bernardino, and a new phenomenon had occurred ... smog.
The South
The Second Great Migration
Southerners were not only pushed out of the South, they were also pulled to the North and West by the particular economic climate created by World War II. Indeed, although black tenant farmers and sharecroppers had migrated to Southern cities and towns in the late 1930s, there was no significant movement out of the region during that time. The net African-American migration from the South during the 1930s was only 347,500, scarcely more than a fifth of what it would be in the following decade. The 1940s movement was driven in part by the tremendous expansion of industrial production during and after the war.
Industrial mobilization began even before America's entry into the war in 1941 following the attack on Pearl Harbor. Once the United States became engaged in a two-front war against Japan and Germany, production shifted into high gear. In addition to the usual needs for munitions, clothing, food, and training facilities, the naval war with Japan spurred increased shipbuilding and the production of naval materiel, much of it channeled to and through Pacific coast ports.
.
After the War
With regards to your graphs which show the dip in east coast states around 1945....
Atlas Map: Postwar Migration to the Sunbelt and West Coast
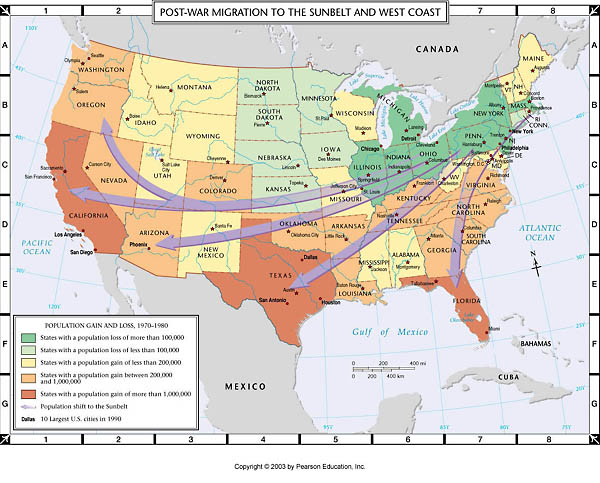 Many Americans were drawn to the West Coast and the Sunbelt (states to the south and southwest) after World War II. This migration was prompted by diverse factors, including the employment opprtunities offered by the growing defense-related industries in these regions and the development of air conditioning, which made residence in these hotter climates more pleasant. The burgeoning populations of these states increased their political power at the exepense of the declining Midwest and Northeast. Were the shifts in population during this period also characterized by a movement from interior regions to coastal areas.
