The statistical illustration published by the BBC of Hatton's data is misleading, The Economist is different:


The original paper is Timothy J. Hatton: "How have Europeans grown so tall?", Oxford Economic Papers, Volume 66, Issue 2, 1 April 2014, Pages 349–372.
Increases in human stature are a key indicator of improvements in the average health of populations. In this article I present and analyse a new data set for the average height of adult male birth cohorts, from the mid-nineteenth century to 1980, in 15 European countries. In little more than a century average height increased by 11 cm—representing a dramatic improvement in health. Interestingly, there was some acceleration in the period spanning the two world wars and the Great Depression. The evidence suggests that the most important proximate source of increasing height was the improving disease environment as reflected by the fall in infant mortality. Rising income and education and falling family size had more modest effects. Improvements in health care are hard to identify, and the effects of welfare state spending seem to have been small.
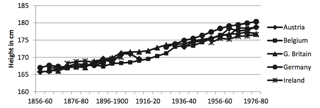
Adult male height by birth cohort, 1856–60 to 1976–80
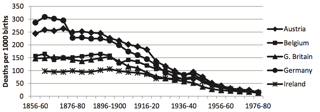
Infant mortality rates, 1856–60 to 1976–80.
Later he presents a table that is interesting, but confusing to interpret due to the chosen frame of reference:
Increase in adult height of birth cohorts in centimetres per decade (GB alone)
| 1871–75 to 1976–80 |
1871–75 to 1911–15 |
1911–15 to 1951–55 |
1951–55 to 1976–80 |
| 0.93 |
1.14 |
0.99 |
0.50 |
As can be seen, well, not as clear as to call it "good", late Victorian Britain might be interpreted as "had quite some problems indicated by a lack of steady progress in health indicators".
The data presented here add to the evidence that growth during early life is an important determinant of adult height. We have argued that adverse conditions during infancy have a long-term influence on linear growth, but there is also evidence that intrauterine nutrition, and thereby intrauterine growth (Kusin, Kardjati, Houtkooper and Renqvist 1992, Falkner 1981) has a long-term effect on linear growth. Furthermore, there is increasing evidence that infancy is a sensitive period during which factors with a negative influence on growth might also influence development, morbidity and mortality later in life. Poor growth during the first years of life has a negative influence on muscle strength and intellectual achievements in adulthood (Martorell et al. 1991)and is associated with increased mortality from cardiovascular disease (Barker, Winter, Osmond, Margetts and Simmonds 1989). Regions with a high infant mortality rate also have a high mortality rate from cardiovascular disease (Barker and Osmond 1986, Forsdahl 1977) and there is a strong negative association between adult height and risk of dying from cardiovascular disease (Waaler 1984, Marmot, Shipley and Rose 1984, Moller, Kristensen and Hollnagel 1991, Barker, Osmond and Golding 1990).
— I.M. Schmidt et al.: "Height of conscripts in Europe: is postneonatal mortality a predictor?", Annals of Human Biology, 22:1, 57–67, DOI: 10.1080/03014469500003702
But just lets go back to the Economist article:
Some research presents a rather alarming picture. Below is a graph which shows the height of English soldiers from 1730 to 1850—a period which captures the First Industrial Revolution.
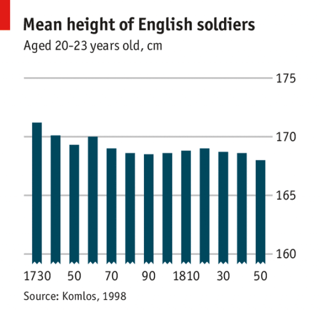
There are many different explanations for height declines during this period. Some people reckon that diseases in cities exploded. Other people think that unsteady economic growth led to increases in the frequency of unemployment, which had an impact on nutrition. And growth of agriculture may have lagged behind economic growth—which meant that the relative price of nutrients increased at a time when transportation was poor and food preservation was primitive.
Other research has shown that city dwellers tended to be shorter than rural folk, even though the urbanites were generally richer. Access to food was easier for those living in rural areas, and so they were better insulated from the effects of harvest failure.
Another paper suggests that it was only in the latter part of the 19th century that growth in heights took off. Wages rose and advances were made in food safety and public health. And for the last 150 years, Britain has been on a steady upward path (see below).
You can tell a similar story about life expectancy. The “expectation of life at birth” (its official name) is calculated by looking at death registrars. If you know the distribution of ages at which people die, you can work out the most likely age to which people will live.
Once again, the picture is not rosy. For instance, in almost all British cities, mortality conditions in the 1860s were no better—and were often worse—than in the 1850s. In Liverpool in the 1860s, the life expectancy fell to an astonishing 25 years. It was not until the two subsequent decades that rises in life expectancy were found (see below right).
That paints a pretty clear picture after all. In terms of hygiene, infant mortality, general health, nutrition and a host of other parameters the modern time of the industrialisation was an overall disaster for the English population. Only during the later part of the late Victorian age these parameters began to slowly and at first unsteadily improve. These effects are of course not immediately reversed when a new generation of humans is suddenly fed properly again. There are epigenetic effects that slow this down again.
In conclusion Hatton more corroborates than contradicts Clayton & Rowbotham.
The Average Height of Adult Men, Life Expectancy and Percentage Urban by Stage of Industrialization (again UK only here):
| Years |
Stature |
Life Expectancy |
%Urban |
| 1720–1760 |
165.1 |
33.7 |
22.6 |
| 1760–1800 |
168.2 |
36.0 |
29.4 |
| 1800–1830 |
170.7 |
38.6 |
38.7 |
| 1830–1870 |
166.9 |
39.5 |
54.1 |
— Richard H. Steckel: "Health And Nutrition In The Preindustrial Era: Insights From A Millennium Of Average Heights In Northern Europe"Working Paper 8542, 2001.
But for soldiers especially there are some other factors to observe as well:
Birth decade (base100=national average from 1740) • England –– + Scotland
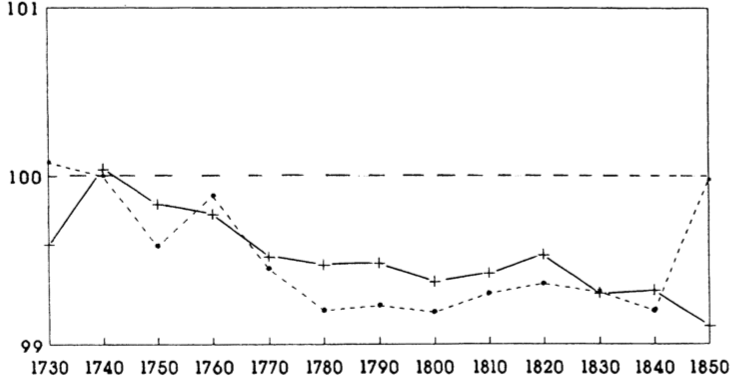
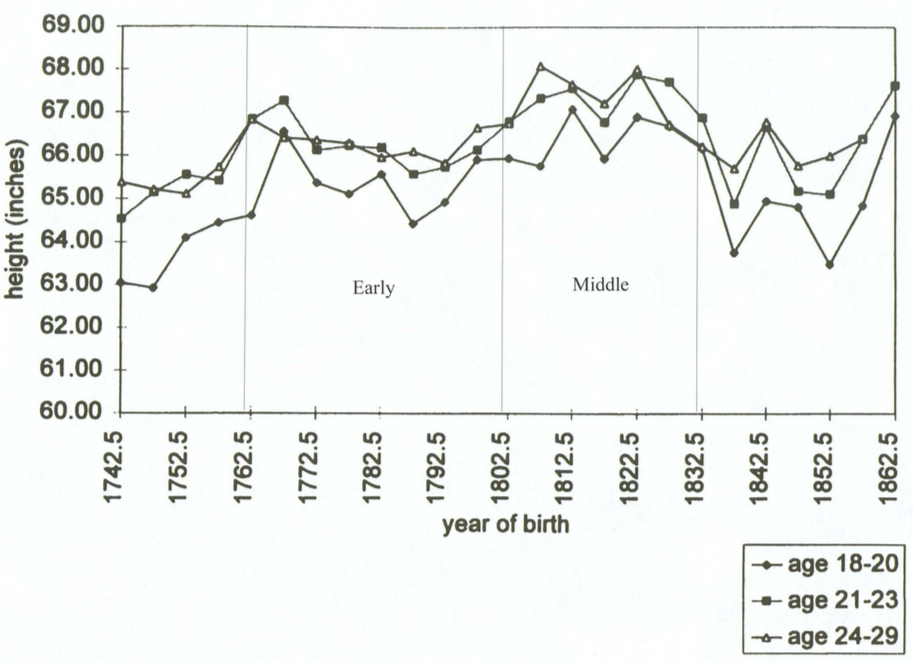
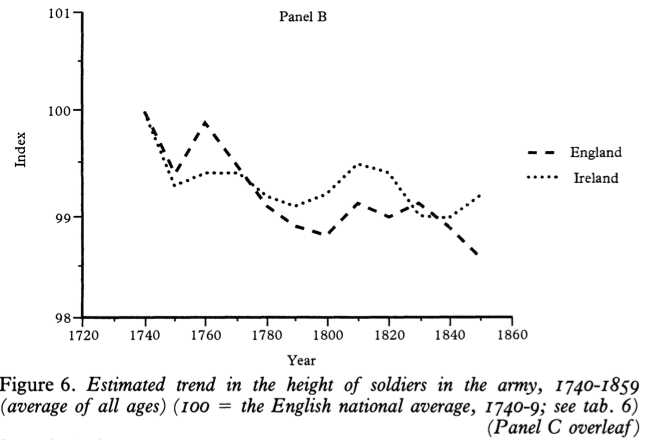
Irish as well as Scottish soldiers tended to be taller than English ones after the 1780s. Similar patterns have been found in many other datasets as well: at the initial stages of economic development, agricultural regions, remote from major markets, tended to enjoy a higher nutritional status than more developed areas. This cross-sectional pattern is practically identical to the one found by Floud and his collaborators. The cross-sectional pattern shows that in general the further a soldier was born from London and the industrializing areas, such as the midlands, the higher was his nutritional status. In this respect my results are in agreement with those published by Floud, Wachter, and Gregory; we also agree on the nineteenth-century trend in nutritional status.
We differ fundamentally, however, over the direction of the eighteenth-century trend. Floud and his coauthors believe that height increased. This is extremely odd as their own evidence shows a monotonically declining trend among the military recruits of all age groups between c. 1762 and 1890, although the tendency gets lost in their smoothing procedure. If it had not been for this technique our results would have differed only for one or two turn-of-the-century decades and even for those we would have differed only in the magnitude of the change, not in its direction. Given the different statistical techniques we used, the similarity between our raw results is actually quite remarkable. The same could not be said for our analysis of the trend in the height of the Marine Society boys. In that respect our results are irreconcilable. The key issue is not what would have resulted if a different smoothing procedure had been used or if the Royal Marine data had not been merged
with those of the infantry. It is rather that, in contrast with the findings of Floud and his colleagues, my statistical approach suggests that the nutritional status of the British and Irish populations was deteriorating during the second half of the eighteenth century. This finding has just been corroborated by an independent investigation of English convicts transported to Australia. In other words, contrary to the claims of Floud and his collaborators, there are hardly any signs of an improving biological standard of living among the lower segments of society during the first century of the industrial revolution. Conditions improved somewhat after the end of the Napoleonic wars, but the eighteenth-century maximum was not reached.
After a weak and temporary recovery a downward tendency is found, beginning with the birth cohorts of the 1830s. The improvements posited by Floud, Wachter, and Gregory for the period prior to 1830 do not appear to have been grounded in changes in nutritional status, but were an artefact of the kind of statistical analysis and sampling strategies they used.
How can one balance the pains of the casualties with the gains of those who remained alive after such a crisis? Perhaps that imponderable question cannot be answered. Yet the ultimate culprit was clearly the demographic expansion; the industrial revolution did at least allow the population to survive. The skewing of the distribution of income is yet another issue which prevented the lower classes from enjoying a greater share of the fruits generated by the industrial revolution.
In conclusion I agree with Floud, Wachter, and Gregory that the anthropometric indices illuminate the British and Irish experience of the industrial revolution. I also agree that, in the main, the above results 'suggest that conventional measures of living standards such as real wages or the level of gross domestic product per capita, which show relatively steady upward trend movements, have misled scholars concerned with the impact of industrialization and economic development on the British people'.
— John Komlos: "The Secular Trend in the Biological Standard of Living in the United Kingdom, 1730–1860", The Economic History Review, New Series, Vol. 46, No. 1 (Feb., 1993), pp. 115–144.
The way the numbers are analysed and interpreted is key.
The most important aspect to consider whether
The fall in nutritional standards between 1880 and 1900 was so marked that the generations were visibly and progressively shrinking.
The authors of this article (Paul Clayton & Judith Rowbotham [CB]), How the Mid-Victorians Worked, Ate and Died, assert that poor nutrition after 1870 in urban areas meant that the British Army (infantry) had to lower the minimum height requirement for recruits from 5ft 6 inches (170.7 cm) to 5ft 3 inches (161.5 cm) in 1883, and that it was then later lowered again to 5ftm (152.4 cm).
is in contradiction to Hatton or not is to be found in aspects CB want to emphasise:
This expansion in the range of foods was advertised by most contemporaries, and by subsequent historians, as representing a significant ‘improvement’ in the working class diet.
This is related to a changed understanding of dietology compared to today. During the time people were still adhering to the Liebig motto of protein as the most important of the few known nutrients and limited knowledge about the difference of caloric and calorific value. No vitamins in sight, diabetes rare etc. The relatively improved nutrition in the middle 19th century was less starvation, the simultaneous decline was a degraded quality and reduced access to actually the full range of needed nutrients known today.
For all these reasons the late-Victorian diet actually damaged the health of the nation, and the health of the working classes in particular. […] In 1904, and as a direct result of the Boer disaster, the government set up the Committee on Physical Deterioration. Its report, emphasising the need to provide school meals for working class children, reinforced the idea that the urban working classes were not only malnourished at the start of the twentieth century but also (in an unjustified leap of the imagination, reinforced by folk memories of the ‘Hungry 40’s) that they had been so since the start of nineteenth century industrial urbanisation. This profound error of thought was incorporated into subsequent models of public health, and is distorting and damaging healthcare to this day.
Then the most important distinction of class in the recruitment pools:
lower the minimum height for recruits from 5ft 6 inches to 5ft 3 inches. This was because most new recruits were now coming from an urban background instead of the traditional rural background. […] Instead, they were forced to reduce it still further, to a mere 5ft. British officers, who were from the middle and upper classes and not yet exposed to more than the occasional treats of canned produce, were far better fed in terms of their intake of fresh foods and were now on average a full head taller than their malnourished and sickly men.
Middle class members contribute to overall average male height. But those do not count as among the smallish recruits in this statistic. CR take a nuanced look at the quality of nutrition where back then and apparently not still mostly the starvation oriented quantity of food intake are in focus. To focus just on dietary effects alone: You need more than three successive generations well fed, with enough calories and all the essential nutrients (we still do not know all of them) to really see a consistent upward trend in adult height. Damage is much quicker than improvement.
To take a further look at what the focus of this team is about:
— Judith Rowbotham & Paul Clayton: "An unsuitable and degraded diet? Part three: Victorian consumption patterns and their health benefits", J R Soc Med 2008: 101: 454–462. DOI 10.1258/jrsm.2008.080114
(Again showing a distribution of micro-nutritional declines after an early Victorian improvement phase rom the 1850s on.)
— Sara Horrell, David Meredith, Deborah Oxley: "Measuring misery: Body mass, ageing and gender inequality in Victorian London", Explorations in Economic History 46 (2009) 93–119.
(Bringing an interesting gender study perspective: average male height discounts half of the picture. Obviously, keeping the male earners better fed than the women is not that of a promising outlook on generational health of mothers and their offspring…)
As the focus is in my opinion way too often and way too much focussed on nutrition alone in both the question and this answer as well, two papers to be read as meta-discussions on the McKeown Thesis:
— James Colgrove: "The McKeown Thesis: A Historical Controversy and Its Enduring Influence", Am J Public Health. 2002 May; 92(5): 725–729.
— Simon Szreter: "Mortality in England in the Eighteenth and the Nineteenth Centuries: A Reply to Sumit Guha", Social History of Medicine, Volume 7, Issue 2, 1 August 1994, Pages 269–282.
If this still fails to address the complicated matter adequately, at least the food part is dealt with comprehensively, if a little outdated in its conclusions by
— John Burnett: "Plenty and Want. A social history of food in England from 1815 to the present day", Routledge: Abingdon, 32005.
The conclusion must be that there does not seem to be any evidence of a general rise in consumption levels over the period 1815-50. The trend in sugar and beer was downwards until 1845, tea was practically stationary throughout the same period, while bread consumption probably rose only after 1847. Sugar and beer are perhaps the best indicators of working-class standards (tea was already a near-necessity and its consumption highly inelastic), and on their evidence those standards were tending to fall rather than rise. However, it seems fairly certain that the trend for most foods turned quite sharply upwards after 1845 — the 1840s as a whole were not demonstrably 'hungrier' than earlier decades, although the early forties may have been. It appears that there might be more justification for the description 'the thirsty forties'.
This is perhaps as far as the national figures can take us.
Statistics of per capita consumption at best establish a framework: they describe the 'average', and the average consumer no more existed in early Victorian England than he does today. To discover more about the food of the past we must turn to classes, groups, and actual people, their earnings and expenses and, where possible, their budgets and household accounts. It is right to start with the occupation which in this period was still the largest of all, that of the agricultural labourer.
Note the apparent focus on calorific quantity and disregard for micronutrients. After starvation is averted, malnourishment can still be achieved despite otherwise adequate caloric input. As can be demonstrated today, people can grow, and grow fat and malnourished by eating high octane junk. Fish and chips is not that bad, but sugar tea and gin and beer contribute to energy intake almost exclusively.
Conclusio
Statistical data is often seen as very hard data. It is not. There are sampling errors, indirect measurements etc. When this has to be analysed the seemingly hard data gets very soft in that it has to be subjected to algorithms that have to be chosen and these again have to be interpreted. This gets even worse when a graph is produced from these aggregates. One and the same dataset can be subjected to different legitimate and correct choices in what to do with them.
Nevertheless, most of these statistics here point in one direction.
The height of people declined during the industrial revolution and only slowly and at first quite unsteadily recovered just barely to previous levels at the turn of the 20th century. "Height" might be used as an indicator for general health, not only nutrition. Air quality, sunlight, poisons and toxins, other stressors, all play a role here. If one generation suffers, the next carries still a burden even if conditions would radically improve. The epigenetic effects for nutrition are especially grievous, though.
Then we have the problem of military recruitment measures as canon. The English army recruits from the realm, but when England started to slowly recover, Ireland and Scotland were clearly not. The statistics used are grouped for birth cohort, while the army does not recruit infants but the result of their upbringing twenty to twenty-five years later. When the standards for recruitment into an enlarged army were lowered the available men were still not as tall on average as they used to be some decades earlier.
These effects were seen not only in the British Isles. The same effects of capitalist urbanisation were recorded at slightly different times but with the same pattern in other countries. Portugal being quite a bleak looking example.
Taking these reasons into account and running with the theme of hard data: the figures presented in the Economist graph show stagnating heights grouped for birth cohort. Assuming that minimum height would be a limiting factor in recruitment, then the especially hard hit lower and urban classes not only simply remained at the low level previously recorded. The most important recruitment pools were effectively shrinking until the time the standards were lowered and conditions started to improve at this late point in time. This was not a story of constant progress. For this time frame it was decline and delay in recovery.


